Tricky Validation Plot
I think this can serve as good interview question ;)
You measure loss and accuracy over some validation set:
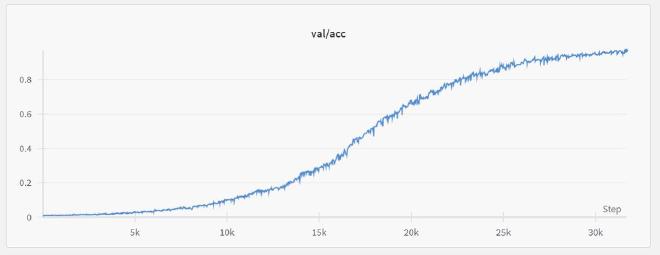
And you end up with plots like below. What’s going on?

I think this can serve as good interview question ;)
You measure loss and accuracy over some validation set:
And you end up with plots like below. What’s going on?
